Good data management is essential for ensuring the validity and quality of data in all types of research and is an essential precursor for data sharing. It is how you collect, organise, store, and analyse your research data. This depends on the type of study you conducted: was it a qualitative study, or a quantitative one? The source of your data: is it primary or secondary data? And the method you used to collect your data.
Questions can include:
-
What is the source of your data? Is it primary or secondary? Please elaborate.
-
Which methods/tools will you be using to collect the data? Please elaborate.
-
How will you clean your data? What issues do you think will come up during this process?
-
Which method of analysis will you be using and why?
https://www.waterboards.ca.gov/resources/oima/cowi/data_management_handbook.html

-
Data collection:
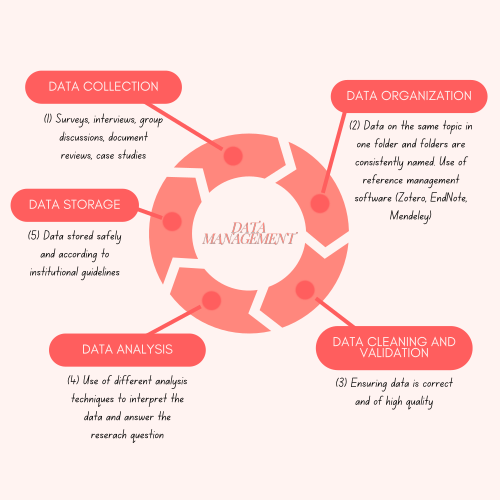
Data collection is collecting data relevant to answering your research question/s and testing your hypothesis. Your study design will determine your data collection methods and tools, as well as the type of data you collect, whether quantitative or qualitative.
For a quantitative study, the data collection methods include surveys, questionnaires (with close-ended questions), interviews (close-ended questions), document review (secondary data), sampling, and observation.
For qualitative studies, the data collection methods include surveys, questionnaires, and interviews (in-depth or focus group discussions). The difference here is that the questions asked to the participants are open-ended; meaning that you give the participants the chance to express their opinions, perspectives, and beliefs.
Data collection tools are what you use to collect the data after you have determined which method you want to employ based on its appropriateness to gather the necessary data to answer your research question.
The tools can be checklists, questionnaires, interview questions, case studies, and forms. They can be administered in paper form (offline), online, or even through the phone.
Whichever method or tool, you determine is the best fit to achieve your study objectives, you must ensure the results they will give you are both reliable, validand reproducible to ensure your research is trustworthy and the results of your study are of meaningful contribution to the field.

-
Data organisation:
After you have collected your data, and before starting your analysis, you must establish a system to organise your data. If you are working in a team, the system and procedure should be agreed upon by you and your team members. This will help the team work better, save time, and avoid any errors.
First, you need to organise your files:
By creating folders that include the files with data/information on a specific topic.
Name the folders and files according to what they contain, and be consistent with how you name your folders and files. A common culture is to append the date to the file name if it will go through several iterations. E.g., “descriptives_work_20240516”.
To avoid confusion, make sure the folders with completed work are separate from those that you are still working on.
Backup all your files and folders so you do not lose your data in case something goes wrong.
Second, you need to manage your references:
While developing your study, you will use publicly available information or published research to support your claims or give an explanation, and you will need to cite all of these sources of information to show readers where you got this information from. But how do you keep track of these sources? And how do you make sure you are citing them the correct way? The answer is: “Reference Management Software.”
The Reference Management Software allows you to collect and organise your references, provides you with different referencing styles that you can choose from, and automatically creates a list or bibliography.
There are different reference management software packages, the widely used ones include:
EndNote, Zotero, and Mendeley.
-
Data cleaning and validation:
Once you have collected your data, you must ensure its quality before you start the analysis. Cleaning your data means removing duplicates, formatting errors, and any incorrect and irrelevant data, as well as completing missing data. Data validation is achieved by selecting the right study design and methodology.
-
Data analysis:
After cleaning the data, the following stage is to identify patterns, trends, and/or correlations that can help you in answering the research question after interpreting the results. This process is called data analysis.
How you analyse your data depends on the type of data you have; is it quantitative or qualitative data?
-
Quantitative data:
If you want to measure the prevalence or magnitude of certain phenomena then this is known as a Descriptive Analysis, for example, you want to know the prevalence of MDR TB in a village, or the number of patients contracting nosocomial infections in a hospital setting.
If you want to measure the relationship between the outcome (dependent variable) and exposure factor/s (independent variable/s) then this is known as Statistical Analysis.
Examples:
-
If you want to determine the relationship between cervical cancer (dependent variable/outcome) and smoking (exposure factor/independent variable), this is a Univariate Analysis, because you are looking at one independent variable.
-
If you want to determine the relationship between cervical cancer (outcome) and two exposure factors, e.g. smoking and HPV, this is a Multivariate Analysis.
-
This online resource provides examples of analyses, strategies, and sample codes in some software (Type of test).
There are several statistical packages and software that can help you with your analysis, including SPSS, R, Stata, Microsoft Excel Spreadsheets, etc. There are several considerations before the choice of analysis software is selected. The most important is familiarity. You tend to be more productive using software you are already familiar with than one you must learn before doing the analysis. Learning a new analysis software can be fun and makes you able to work with more people, if that is your wish.
Some broader considerations for the choice of software are discussed below:
-
Interface: Some software provides a point-and-click interface (Graphical User Interface, GUI), others will require you to write the commands (script), while some software provides an interface for both. Point-and-click interfaces are easier to use and often intuitive. However, their drawback is that they are not reproducible. If you must redo the analysis, you will have to redo every step. Scripting programs require you to write in a particular style (syntax). They are not easy to start but very reproducible. The scripts can be used later to redo the analysis or even a different analysis.
-
Availability: Some of the software are proprietary and commercial. You must buy the software before you use it. Some institutions provide the software to their workers/students, so be sure to check if your institution provides your desired software. There are free/open-source software programs that are available to use at no charge. Free software means you don’t have to buy it, and open-source software means you can make changes to the software (sometimes with attributions).
-
Learning curve: it is more difficult to learn some of the software than others. Scripting languages are more difficult to learn initially, but they do pay off in the long run. It can take you about three months to learn a scripting language, while you may need about two weeks to learn one with a GUI. Do not be discouraged from learning scripting language because it pays off once you are comfortable with it. If you were move to a different country, you can decide to hire an interpreter or learn the language, it pays off eventually if you learn the language.
-
Productivity: Some software allows you to do a lot with it than others. Some software can also be automated to do certain tasks on their own without user input. Scripting programs are more productive as they are just scripts. They can be integrated into the operating system to perform some automatic tasks. Productivity also refers to their usage. Some can do more than simply analysis data, they can be used to create dashboards, reports/documents which can be shared with others. R is particularly good at this for data analysis, while Python is a good option for image recognition.
Free/Open-Source vs Commercial
Buying commercial software often comes with support. There are dedicated people to help you should you be stuck. Free/Open-source software doesn’t have the support of commercial software, but there can be a lot of online help and tools to help you when you need it. Other times, other people write extensions/packages to this software, making them additionally useful.
|
Software |
Interface |
Availability |
Learning curve |
Productivity |
|
Scripting |
Free and Open-Source |
High |
High |
|
|
Scripting |
Free and Open-Source |
High |
High |
|
|
User interface |
Free |
Easy |
Low |
|
|
User interface |
Commercial |
Moderate |
Moderate |
|
|
User interface and Scripting |
Commercial |
Moderate |
High |
|
|
User interface |
Commercial |
Moderate |
Moderate |
|
|
User interface |
Commercial |
Moderate |
Low |
|
|
|
Commercial |
Moderate |
High |
While Microsoft Excel is a useful tool in the data analysis process, it is severely limited and must be used with caution. Some journals may not accept analysis done in Excel.
-
Qualitative data:
To analyse your qualitative data, the initial step is to familiarise yourself with the data and then code your data. You attach specific codes to your data according to your interpretation of what the data conveys (See this discussion).
There are different approaches to analysing qualitative data, which include:
-
Grounded Theory Analysis: this is an iterative process, where you code the data, line by line, in tandem with the collection process. You identify the themes as they emerge and the overall theory that best explains the phenomena under study. The process of coding and analysing continues until the data collection reaches the saturation point, which is when the data no longer produces new themes.
-
Thematic Analysis: this is different from the grounded theory in that you start the coding after the data collection is complete. Here you code your data in chunks rather than going line-by-line and you look for themes rather than a theory. But the idea is somewhat similar: you code your data and look for themes that emerge.
-
Framework Analysis: in this analysis, you already have an idea about the themes that will emerge and hence the codes, you are not looking at the data to develop them. As you analyse the data you assign the predetermined codes to them and rearrange the data within the framework under the most suitable category.
There are several software applications that can support the analysis of qualitative data, which include NVivo and Dedoose.
5. Data storage:
To store your data safely, you can use several software applications, including Kobo and REDCap.REDCap can only be provided by institutions as it is not available for individuals. Kobo, on the other hand, can be used and managed by one person. It is commercial software, but a free but limited version is available.
Note: For any serious research work, avoid using Google Forms or similar products. They are easier to use, but they encourage behaviours that can be very challenging during analysis, such as the way they handle checkboxes.
When it comes to data storage, the best practice is to follow your relevant institutional guidelines and regulations. The most important thing,whether you use electronic or paper-based data, is to ensure they are kept safe and only accessible to authorised personnel. The data should NOT be kept for longer than what your institution recommends.
Safe storage of your data can help you if you want to access it again in the future for any reason. It will also be beneficial if you want to defend yourself and your institution against any allegations of misconduct.